

Merlin Asset Management – The Growth Strategy Company
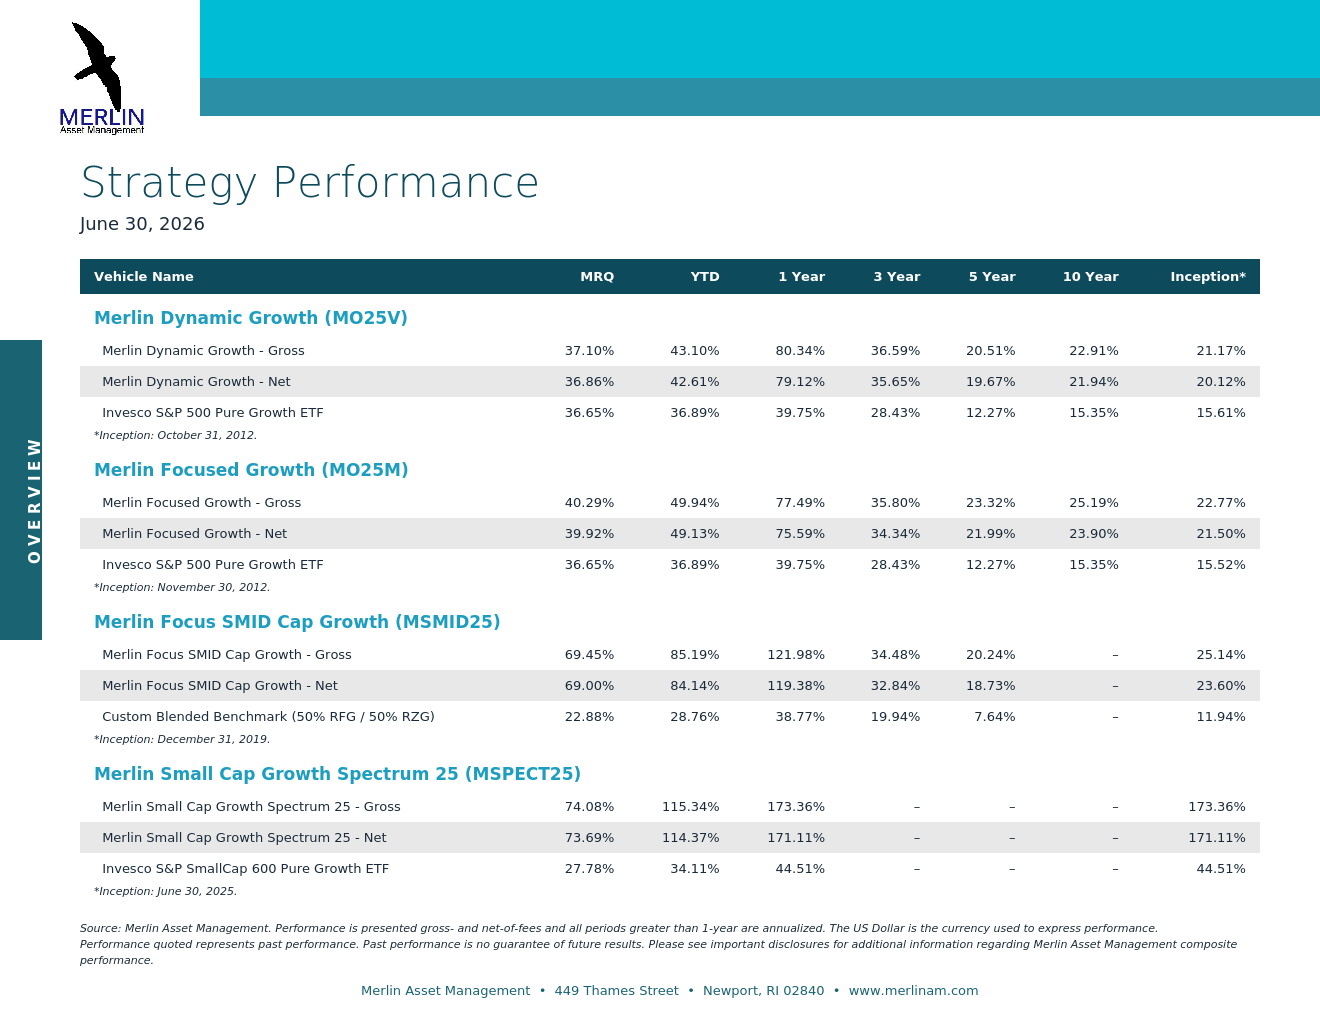
Merlin Asset Management strategy performance, gross and net of fees, as of June 30, 2026
Three Merlin strategies ranked first and Focused Growth ranked second for one-year returns in their PSN growth universes; periods ended June 30, 2026
NEWPORT, RI, UNITED STATES, September 15, 2026 /EINPresswire.com/ — Merlin Asset Management, an independent investment firm specializing in concentrated, high-conviction growth strategies, announced today that its concentrated 25-stock strategies earned first-place rankings for trailing one-year returns in each of three growth universes on PSN’s Q2 2026 Top Guns List: Large Growth, Small-Mid Growth, and Small Cap Growth. Merlin Focused Growth ranked second in Large Growth for the same period. The release also reports three-year rankings where available. All evaluated periods ended June 30, 2026. This marks the 13th consecutive year in which Merlin has received PSN Top Guns recognition. PSN is a division of YCharts.
“We are pleased to see our concentrated strategies recognized across large-cap, SMID, and small-cap growth,” said Michael Obuchowski, Ph.D., Founder and Chief Investment Officer of Merlin Asset Management. “We remain focused on the disciplined research and portfolio construction process we apply consistently to each of them. Rankings reflect past results and do not predict future performance.”
PSN Top Guns Rankings (trailing periods ended June 30, 2026)
PSN Top Guns rankings are based on gross-of-fee returns reported to the PSN database. The net-of-fee figures in this release are from Merlin’s GIPS composites and were not the basis for the PSN rankings. YCharts published the Q2 2026 rankings on August 26, 2026. Merlin paid no fee to PSN or YCharts to participate in, obtain, or use the ratings.
PSN Large Growth Universe (219 products): Merlin Dynamic Growth (MO25V) ranked #1 and Merlin Focused Growth (MO25M) ranked #2 for both the one-year and three-year periods. Net of fees, MO25V returned 79.12% for one year and 35.65% annualized for three years; MO25M returned 75.59% for one year and 34.34% annualized for three years.
PSN Small-Mid Growth Universe (71 products): Merlin Focus SMID Cap Growth (MSMID25) ranked #1 for one year and #2 for three years. Net of fees, MSMID25 returned 119.38% for one year and 32.84% annualized for three years.
PSN Small Cap Growth Universe (143 products): Merlin Small Cap Growth Spectrum 25 (MSPECT25) ranked #1 for the one-year period. Net of fees, MSPECT25 returned 171.11% for one year. The strategy was incepted on June 30, 2025, and has a one-year track record; no longer-term history is available.
Longer-Term Net-of-Fee Performance (periods ended June 30, 2026)
MO25V returned 19.67% annualized for five years, 21.94% for ten years, and 20.12% since inception (October 31, 2012). MO25M returned 21.99% annualized for five years, 23.90% for ten years, and 21.50% since inception (November 30, 2012). MSMID25 returned 18.73% annualized for five years and 23.60% since inception (December 31, 2019). The accompanying performance exhibit shows gross-of-fee returns for all periods, along with benchmark returns.
Broadridge Rankings (U.S. Large-Cap Growth Equity, net of fees)
Merlin Dynamic Growth (MO25V) ranked first in Broadridge (powered by Lipper) rankings of U.S. Large-Cap Growth Equity products for the trailing one-year (145 ranked products), three-year (137 products), five-year (130 products), and ten-year (113 products) periods ended June 30, 2026. Broadridge MarketPlace published the rankings in August 2026. These rankings compare trailing returns ending on the same date; they do not indicate first place in every intervening period and do not predict future results.
Concentrated 25-stock growth portfolios can experience substantial volatility and loss and may be far more volatile than broad market indices; smaller-company stocks may be less liquid and more volatile. Merlin’s strategies may carry meaningful sector concentration, including in technology. Rankings and returns reflect historical results only.
To learn more, visit www.merlinam.com.
Important Disclosures
PSN Top Guns Third-Party Rating: Created, calculated, and tabulated by PSN, a division of YCharts; rankings for trailing periods ended June 30, 2026, published August 26, 2026. Ranked on gross-of-fee returns reported to PSN; managers must claim GIPS compliance. Universe product counts reflect universe membership as reported by PSN. Merlin Asset Management paid no fee to PSN or YCharts to participate in, obtain, or use this rating, including for badges, reprints, or enhanced placement.
Broadridge Third-Party Rating: Produced by Broadridge Financial Solutions, Inc. (powered by Lipper); rankings for trailing periods ended June 30, 2026, published by Broadridge MarketPlace in August 2026, U.S. Large-Cap Growth Equity category, based on net-of-fee returns reported to Broadridge. Merlin Asset Management paid no fee to Broadridge to participate in, obtain, or use this ranking, including for reprints or enhanced placement.
GIPS Compliance: Merlin Asset Management claims compliance with the Global Investment Performance Standards (GIPS). GIPS is a registered trademark of CFA Institute. CFA Institute does not endorse or promote this organization, nor does it warrant the accuracy or quality of the content contained herein. Each strategy is a separate GIPS composite. A GIPS Composite Report is available on request.
Performance: All returns are in U.S. dollars, include reinvestment of income, and are annualized for periods over one year; one-quarter figures are not annualized. Gross returns are gross of management fees and net of transaction costs. Net returns reflect deduction of actual management fees and transaction costs; investors may pay different fees. Results include fully discretionary accounts, including those no longer with the firm. Standard fee schedule: 1.35% on assets to $1M, 1.00% from $1M-$5M, 0.80% from $5M-$10M, negotiable above $10M. Benchmarks: MO25V and MO25M, Invesco S&P 500 Pure Growth ETF (RPG); MSMID25, 50% Invesco S&P MidCap 400 Pure Growth ETF (RFG) and 50% Invesco S&P SmallCap 600 Pure Growth ETF (RZG), rebalanced monthly; MSPECT25, RZG. ETF expense ratios are 0.35%.
Past performance is not indicative of future results. Investing involves risk, including loss of principal. Rankings compare strategy-level performance and do not describe any particular client’s experience. Individual account results may differ.
About Merlin Asset Management
Merlin Asset Management is an independent, employee-owned investment adviser registered with the State of Rhode Island that builds concentrated, high-conviction portfolios of innovative growth companies. Our Merlin Investment Process (Merlin IP) combines data-driven research with neuroscience-informed insights to reduce cognitive biases and pursue long-term capital appreciation through benchmark-agnostic, low-turnover strategies.
Michael Obuchowski
Merlin Asset Management
+1 617-366-2650
email us here
Visit us on social media:
LinkedIn
Other
Legal Disclaimer:
EIN Presswire provides this news content “as is” without warranty of any kind. We do not accept any responsibility or liability
for the accuracy, content, images, videos, licenses, completeness, legality, or reliability of the information contained in this
article. If you have any complaints or copyright issues related to this article, kindly contact the author above.